Metrics Reporting

Metrics can be a tough topic to convey to people who are used to deleting 50+ emails every day. It’s understandable that people will simply scan through an email without taking it in when the average employee spends 23% of their time reading mails (https://tinyurl.com/hmwadz7or even just delete it outright when they receive many through the day.

In my job as Scrum Master two competencies I value include transparency and feedback. This applies the work I do as well as the teams I work with.

Metrics are important for a number of reasons including making us more predictable, identifying bottlenecks and primarily as an aid to help us improve. They are of use to a diverse range of people including Developers, Scrum Masters and Product Owners. So it is of some value if we can get interested parties to read and understand what the metrics are saying – the delivery of this information is important.

Several years ago I used to send the information out in the form of an email like this:

screen-shot-2017-02-09-at-14-42-43

While this contained lots of information it proved to be an ineffective way to share it. I found that after months of delivering the data in this way people got bored and in the end didn’t read it. I sought out ways to improve the read count of this information and have managed to improve this. In searching for new ways to report I stuck to 3 simple rules:

  1. The information has to be presented in a simple way.
  2. The information has to be attractive to look at.
  3. The way we present the data has to change on a regular basis in order to keep peoples attention.

I discovered that there were web based infographic tools available which would solve most of these problems these include Venngage, Piktochart and Canva. Piktochart was the one I chose – mainly due to its easy of use.


This is what the report now looks like:

screen-shot-2017-02-09-at-15-47-01

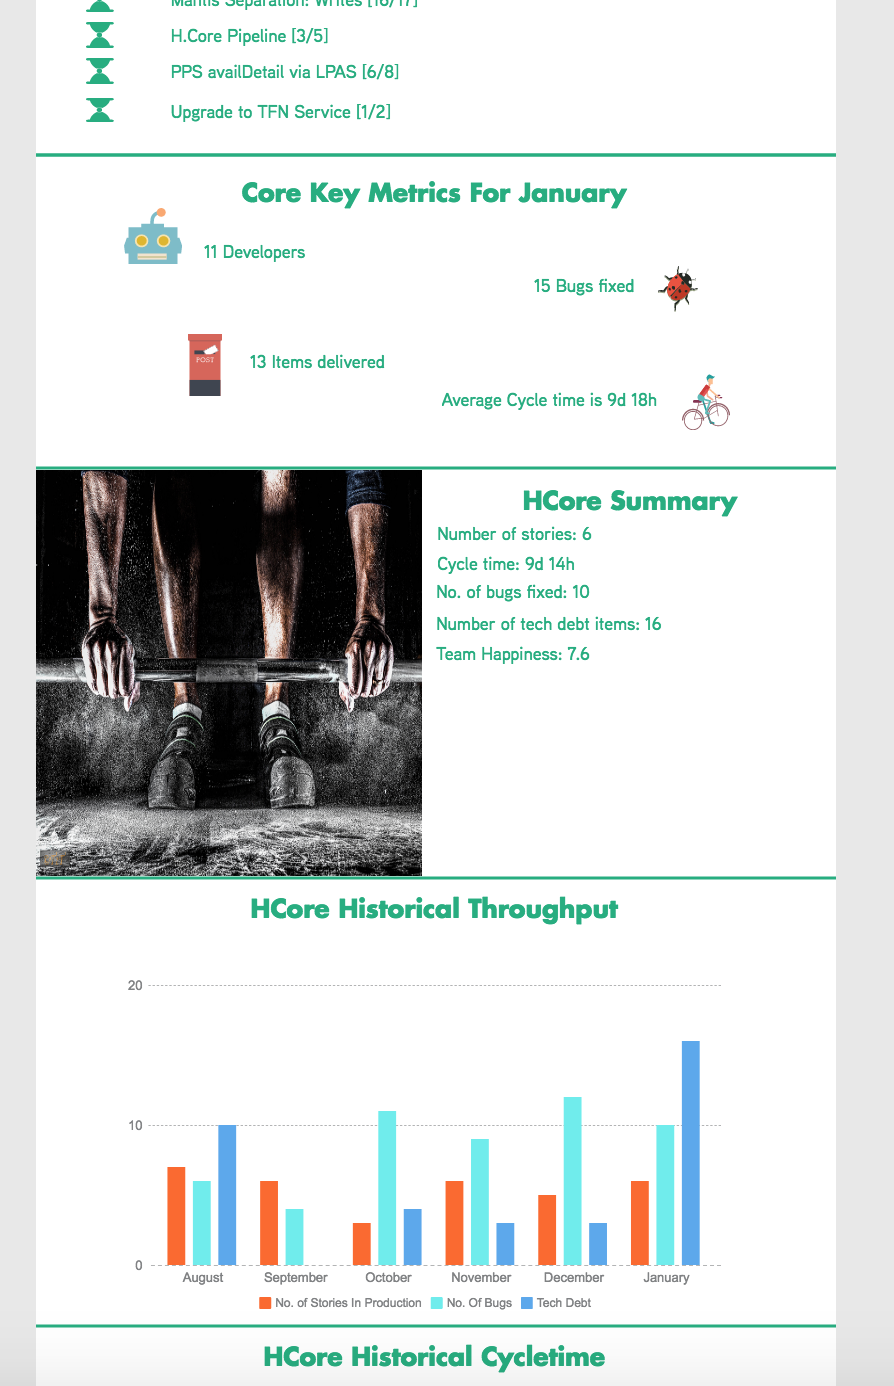
The full version can be found here.


This is simple, nice to read and I try to make sure that it looks different every time I send it out.


As well as improving the presentation and the delivery of the report, I also look to improve the metrics we collect every month. It is also good to focus the report on areas to tackle whichever problems the team are facing. All of these have helped to improve the transparency and feedback to the team and stakeholders.

Little’s Law: It’s about WIP

When we discuss Kanban and WIP limits Little’s law is often quoted. I set out to get an understanding about what it is and how we can use it to help us as we learn about Kanban.

The first place to look was Wikipedia and this is what I found:

In queueing theory, a discipline within the mathematical theory of probability, Little’s result, theorem, lemma, law or formula[1][2] is a theorem by John Little which states:

The long-term average number of customers in a stable system L is equal to the long-term average effective arrival rate, λ, multiplied by the (Palm‑)average time a customer spends in the system, W; or expressed algebraically: L = λW.

A little further digging and I discovered that Little’s example was applied in a shop context. How can we apply this to Kanban?

The first step is to understand how we can map Little’s formula to things that have meaning in Kanban. From the above equation we can say L represents the Work In Progress Limit (WIP),  the arrival rate, λ, is equivalent to the Kanban concept of Throughput (TP) and W can be mapped to the Lead Time (LT).

Lets try out the theorem and see if it works:

Work In Progress = Throughput * Lead Time

In one of my teams the Lead Time is 6 days. The Throughput is 11 items a month. I have to convert the Throughput value to use the same units as the Lead Time so lets assume there are 20 working days / month and calculate Throughput as 11/20 which gives us a Throughput of 0.55.

Work In Progress = 0.55 * 6 = 3.3

So we get a WIP of 3.3 for this system. This makes sense as our WIP is currently 4 and we sometimes run below this limit.

So what other information does this theorem tell us? How about if we swap round the formula?

Lead Time = Work In Progress/Throughput

If the theorem holds true this tells us that the LT will reduce if either the WIP is reduced in a system or the TP is increased.

This is the most common way Little’s law is expressed in the Kanban context. Why is reducing LT important? Well – the longer it takes for items to be completed the less value they have to the customer. The longer an item remains in progress the higher the chance that requirements might change or the need for the item changes. The cost of delay is also worth considering too.

So how would we go about decreasing LT? We could try to improve the TP. In order to do this we could hire more people for the team or we could improve the technologies we are using. These both tend to be quite difficult to achieve and may have knock on effects to other aspects of the team like moral while having significant ramp up times.

An easier option would be to reduce the WIP. We could commit as a team to reduce the WIP to an agreed level.

In the software development context reducing the WIP means that items can be delivered faster and with greater predictability (based purely on shorter LT).

It’s common practice in Kanban to reduce WIP. Little’s law forms the basis of this concept. When we talk as a team about reducing WIP we talk about things like context switching and improved focus which are both positive consequences of reducing the WIP. While this article covers a very generalised view of Little’s Law it’s helpful to have some level of awareness towards the law. It enables us to think of the underlying principles of Kanban when introducing the WIP concept to teams which will ultimately help them improve. It’s useful to bring out this equation when introducing teams to Kanban to help emphasise the importance of monitoring and reducing WIP.

Here is an short video which helps to get across some of these ideas:

Why WIP makes sense

Focus

In this article I’m going to describe how by changing the focus of a team we can improve the way we work.

So how do we get a team to focus on the work that’s important? One way is to prioritize the topics in any conversations a team has so that the most important pieces of work are discussed first.

I coach a team practicing Kanban and every morning we have a stand up. For this we gather round the Kanban board and begin to talk about the items on it.

A typical Kanban board
We like to talk about the most important items first so we usually start off discussing the blocked items and what we can do to unblock them.Once these items have been covered we then moved to the items further down the board. We naturally start off at the left side of the board and work our way across towards the right side.

However we should ask ourselves – are stories in the backlog really the most important items for us to chat about? A phrase often used in the Kanban world is “Stop starting, Start finishing”. This tells us that our focus should be on finishing stories. To enable this I suggested we begin the stand up by talking about the items that are closest to being complete. Simply – we started to read the board from right to left.

As a result, the team became more focused on completing the items closest to being finished. By focusing in on the items closest to being completed we have seen a drastic reduction in our cycle time. This was reduced from several weeks down to 7-8 days.

Changing the way we read the board means that the last thing for the team to talk about in the stand up is the backlog and whether we could bring something in to work on. It makes sense to discuss this last in the stand up once we have a good understanding of our current state.

This change is a major factor in us thinking about Kanban as a pull system rather than the push mentality we had before.

Retrospectives: Muda, Muri and Mura

The idea for this retrospective was initially put forward by one of my managers. He suggested that a variation on Value Stream Mapping combined with Muda, Muri and Mura could potentially be a way to enable the team to look at our work from a different perspective. The overall aim of the session was to identify waste in our process. We can then focus on eliminating this waste in the future and hopefully reduce the time between initial idea and it going into production (lead time).

Muda, Muri, Mura (MMM) is one of the philosophies behind the Toyota production system (http://blog.toyota.co.uk/13-pillars-of-the-toyota-production-system). As the Toyota blog tells us – MMM “work in tandem to eliminate waste”. Muda is a non-value adding activity, Muri means to overburden and Mura includes unevenness.

To start off the session I began by explaining MMM. I expected these ideas to be difficult to explain however it proved much easier than I imagined and the team members understood the concepts without any difficulty.

The next step was to create a stream map of our process. The idea is to understand what steps are required to put an idea into production.


We then mapped this onto a board.


The next step was a brainstorming step where the team members gathered together items which belong to each of the MMM categories. We had different coloured sticky notes for each category. The team members then took turns to put their items onto the board.


The team then grouped the items into themes.


They then voted on the theme they would most like to chat about and we managed to boil these down into several actions.

As an extension to the normal retrospective I then gathered all the data from the session. We plan to group this data with other teams who are carrying out similar sessions. This will enable us to identify any common problems which may be afflicting the teams across the organisation. We can then focus on these as areas which will bring greatest improvement to our lead time.


Afterwards


Overall I felt this session went well. I initially thought that the concept of MMM might be difficult to get across however the teams didn’t appear to have much a problem with this.


We had booked the meeting room for 1 hour and I expected us to complete the session within that time frame. This proved to be too ambitious and I would recommend booking this session for 2 hours.


Helping the team to focus on the entire process from the very conception of the idea until it goes into production adds a significantly different angle to the usual retrospective. I am quite confident that by working with the other teams to identify common issues we can start to have an impact on the lead time of our ideas.

Retrospectives: The Cool Wall

In the agile world we are continuously looking to improve. The retrospective is a period of time conducted at the end of a sprint to enable us to look at what happened and to identify ways we can improve. There are various techniques we can employ in the retrospective that will enable us to get to our goal, which in our case is, to identify some actions which the team can then work with which will help us to get better.
 
Recently I felt we fell into a rut with our retrospectives and occasionally we were unable to agree on any actions for us to help improve the team. I began to look at alternative techniques for running our retrospectives and for helping the team to think about the previous sprint from a different angle.
 
I came across the cool wall (https://waynedgrant.wordpress.com/2013/04/21/sprint-retrospective-techniques-2/). I felt that the team would enjoy this technique and respond in such a way that we would be able to come up with something useful.
 
I selected 20/25 different topics for the team to discuss and took the team through the process (these are listed at the bottom of this page).
 
During the data gathering process I noticed that the team were fairly consistent in their assessment of many of the topics. Some topics were easy to grasp and we quickly placed them on the board while others took a little bit of discussion before the team were happy. The team were a little unsure about the context of some of the topics I had chosen. I agreed that some of the topics were difficult for the team to grasp and pulled them from the list.
 
At the end of this process we then moved on to the discussion phase of the retrospective. We deliberately targeted the topics which had been placed at the lower end of the list. This provoked a productive discussion about these topics and we quickly came up with actions to help improve each topic.
 
Overall the team enjoyed this approach to retrospectives and felt that it produced new insights into various aspects of our work which we wouldn’t otherwise have seen.
 
I feel that this is a particularly useful technique to use when we want to analyse the broader context of the life of the team rather than focusing on the previous sprint which normally happens. While teams wouldn’t want to carry out broad retrospectives like this all the time I would recommend this technique to be used periodically to help improve more general topics. 
 
Learnings:
  1. Make sure the topics you choose are related to the team – not all topics fit all teams.
  2. New retrospective techniques will help to inspire different thought processes around your team.
  3. The cool wall is a great technique to help drive a more general understanding about the work of the team.
  4. This technique is most helpful when we want the team to think about the broader context of their work rather than focusing on the most recent sprint.

The topics chosen:

Testing
Dealing with bugs
Devops Role
Team Efficiency
Driving down on waste
Communication with other teams
Planning
Code Reviews
Investing in tech
Morale
Maintaining our codebase
Time keeping
Pairing
Teamwork/communication
Investing in process/tooling
TDD
Story granularity
Keeping a clean build
Asking for help